

What is Firefox chrome_debugger_profile folder
I have several profiles. They all have the same Chrome folder contents, but only some of them have the "chrome_debugger_profile" folder.
I'm guessing I must have generated it along the way while tweaking the Chrome folder contents?
Επιλεγμένη λύση
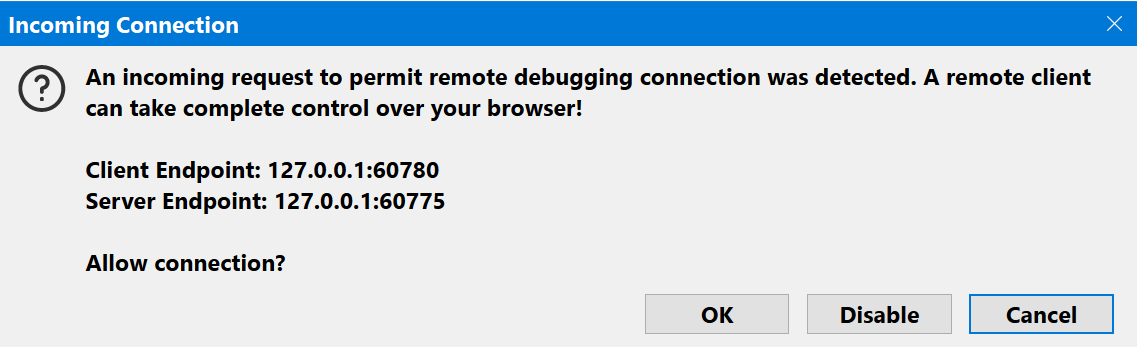
You can safely delete the chrome_debugger_profile folder. If you aren't going to use the Browser Toolbox, you should disable "Enable browser chrome and add-on debugging toolboxes" and also disable "Enable remote debugging" in developer tools settings (F12 then F1).
Όλες οι απαντήσεις (5)
It's created when you open the Browser Toolbox (Ctrl+Shift+Alt+I).
So this is nothing to be concerned about, right? I don't remember ever seeking or enabling it.
What would be the benefit of doing it? Can I assume I can delete the folder?
Τροποποιήθηκε στις από το χρήστη noel_envode
Επιλεγμένη λύση
You can safely delete the chrome_debugger_profile folder. If you aren't going to use the Browser Toolbox, you should disable "Enable browser chrome and add-on debugging toolboxes" and also disable "Enable remote debugging" in developer tools settings (F12 then F1).
zeroknight said
You can safely delete the chrome_debugger_profile folder. If you aren't going to use the Browser Toolbox, you should disable "Enable browser chrome and add-on debugging toolboxes" and also disable "Enable remote debugging" in developer tools settings (F12 then F1).
Thanks